Decoding wearable sensor signals - what to expect from your E4 Data
Empatica
• 7 min read
Whether you have recently purchased an E4 or landed here after researching wearable solutions for physiological data collection, you might be wondering how exactly the data from an E4 wristband can fit into your studies and what that data will actually look like. To answer your questions, this blog post will offer an overview of the E4 and its most used data outputs.
The E4 remains to this day the wearable of choice for many researchers and institutions that value the variety and quality of its sensors and, above all, the possibility to download raw unprocessed data. These raw sensor readings allow for a deeper investigation into the researched physiological parameters.
So how is this data presented and how can it be processed? Let’s look specifically into the main sensor data for PPG and EDA to get an idea.
BVP The BVP stands for Blood Volume Pulse, and it's the primary output from the E4 PPG sensor and derived from the combination of two different measures of the amount of light that is reflected and goes back to the sensor.
The BVP signal is obtained by a proprietary algorithm that combines the light signals observed during both green and red exposure. It has a fixed sampling rate of 64 Hz (64 times per second).
the environmental conditions during the recording (temperature and humidity of the room)
physical characteristics of the study subjects (different skin tones might produce different readings)
The data can be visualized in the E4 connect portal, as displayed below, or downloaded in its raw format as a .csv file to be plotted on these recommended data processing tools.
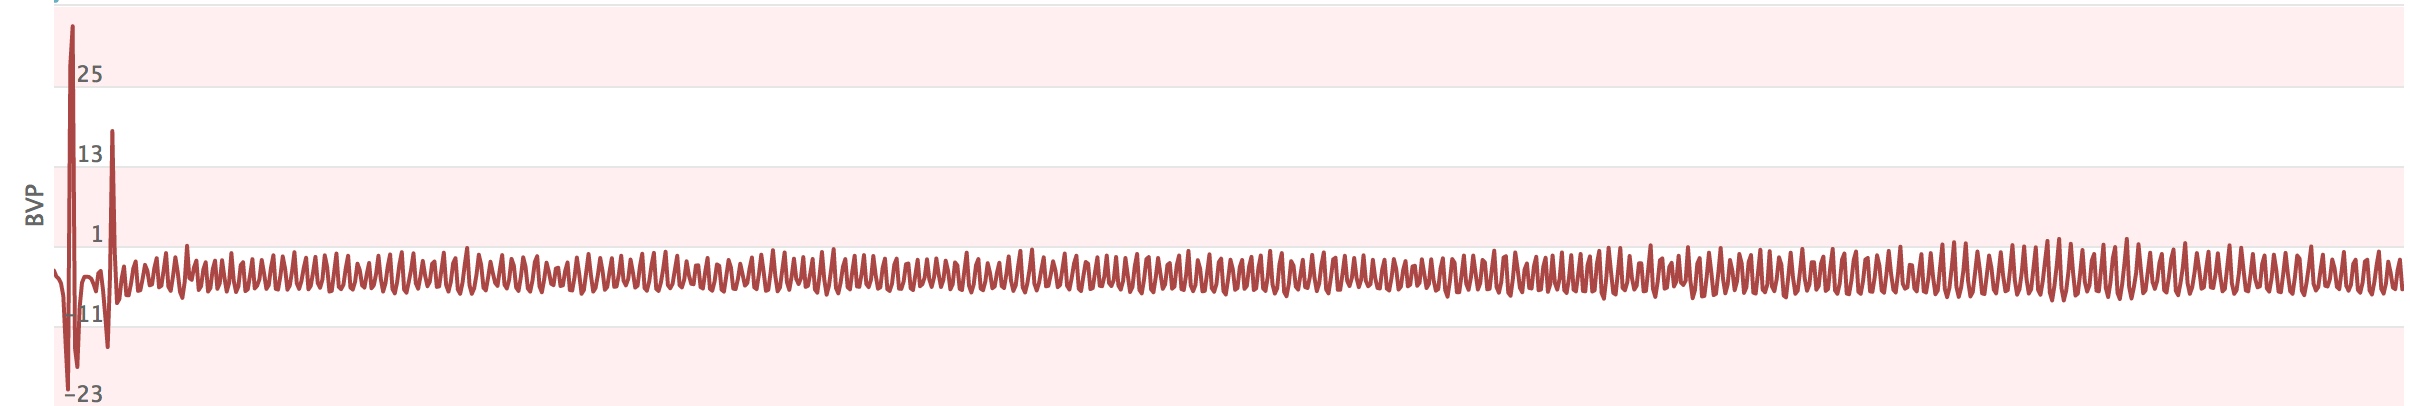
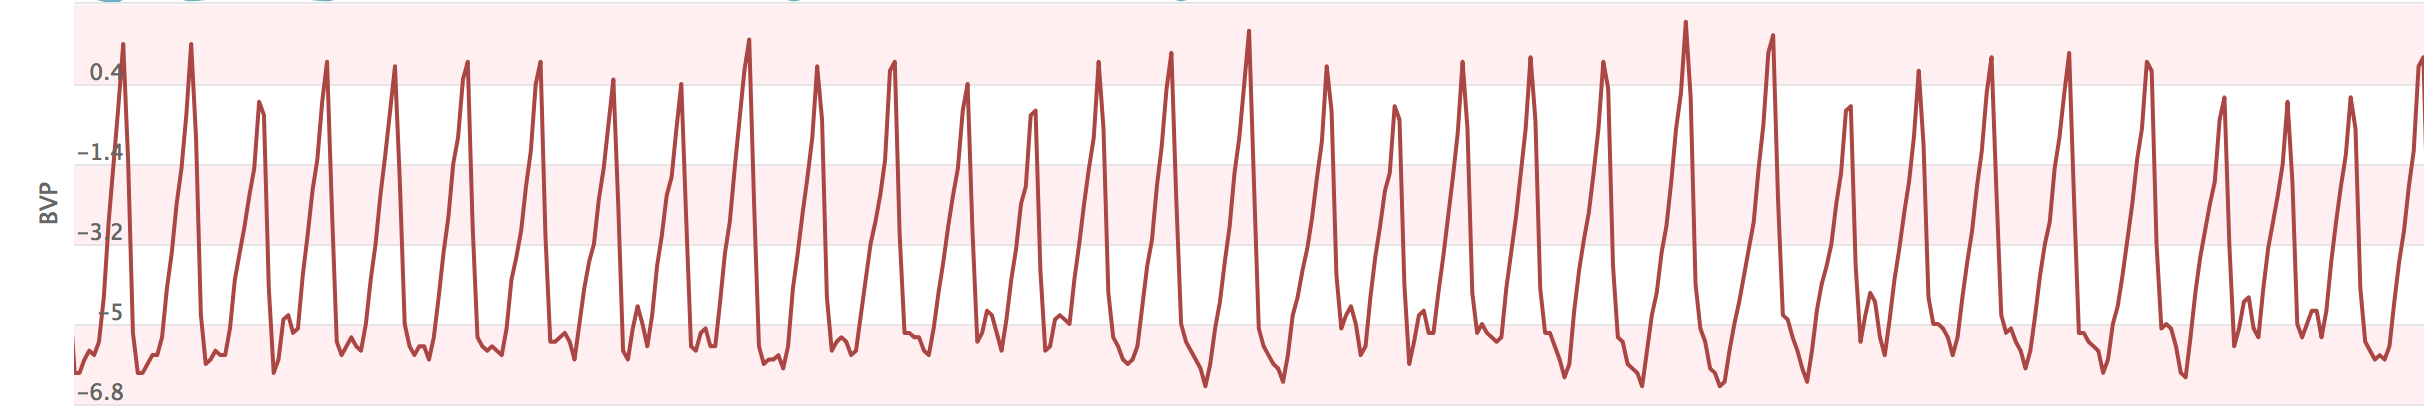
Example of a session with a BVP output
Example of the signal at the beginning of the session (the first 30 seconds)
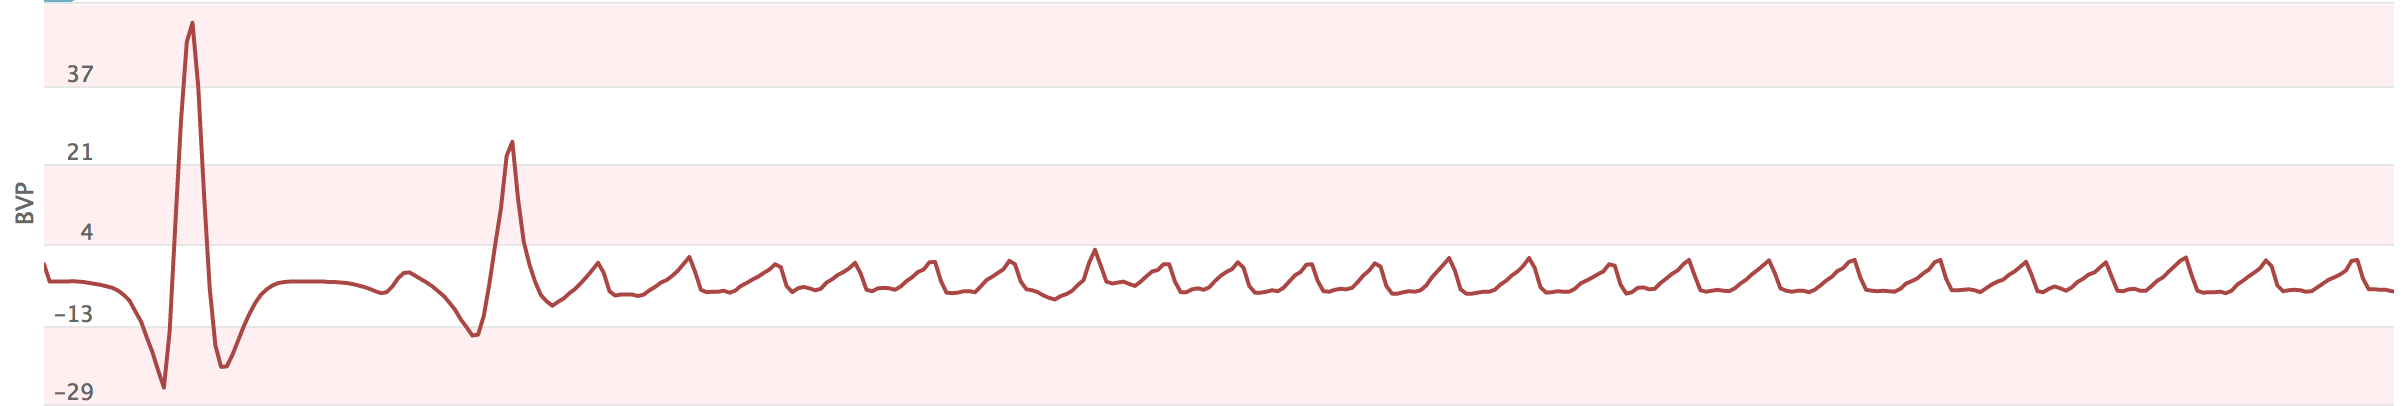
Example of the signal when it has stabilized (some seconds after the beginning of the recording)
EDA Electrodermal activity refers to electrical changes, measured at the surface of the skin, that arise when the skin receives innervating signals from the brain. There are two main components to the overall complex referred to as EDA. One component is the general tonic-level EDA, which relates to the slower acting components and background characteristics of the signal (the overall level, slow climbing, slow declinations over time). The most common measure of this component is the Skin Conductance Level (SCL), and changes in the SCL are thought to reflect general changes in autonomic arousal.
The other component is the phasic component and this refers to the faster changing elements of the signal - the Skin Conductance Response (SCR). The SCR threshold has historically been set at around 0.05 uS, however, it’s not uncommon to consider a minimum amplitude that varies from 0.01 to 0.05uS, and the choice will be influenced by experimental conditions.
The EDA reading is influenced by:
the length of the recording
the position of the electrodes on the body
the environmental conditions during the recording (temperature and humidity of the room)
demographic and physical characteristics of the study subjects (age, health history, medications taken)
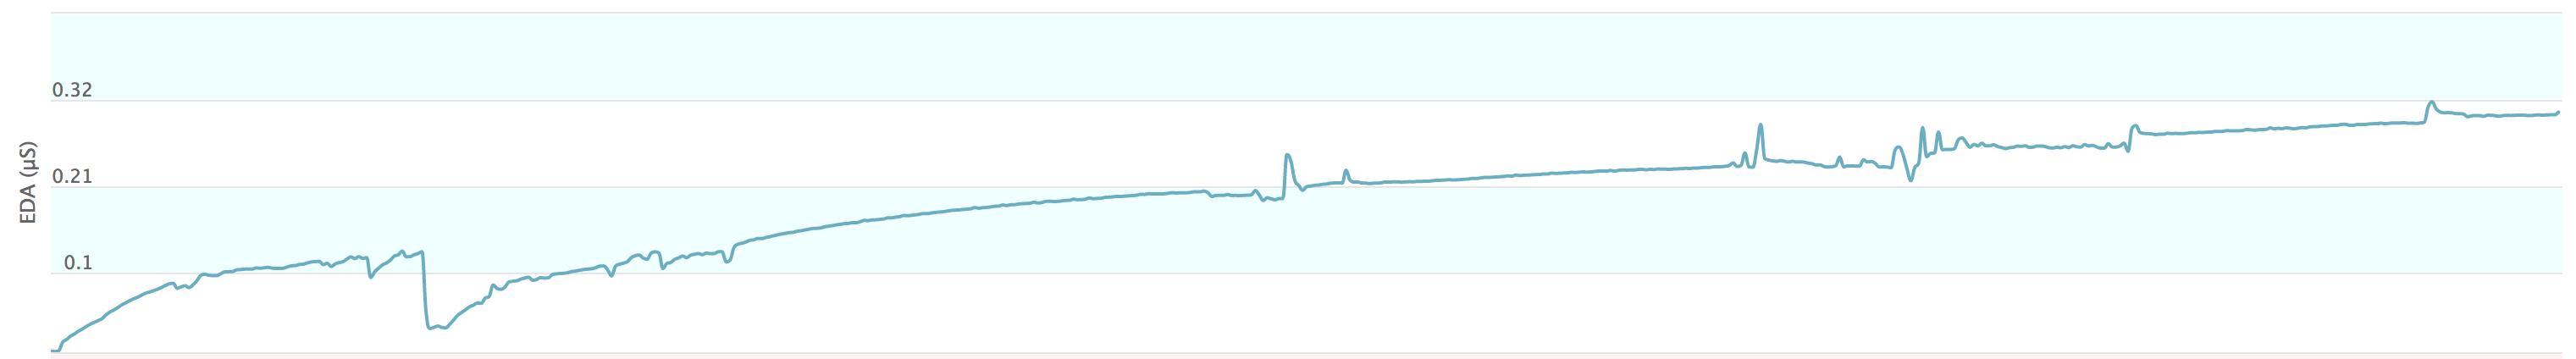
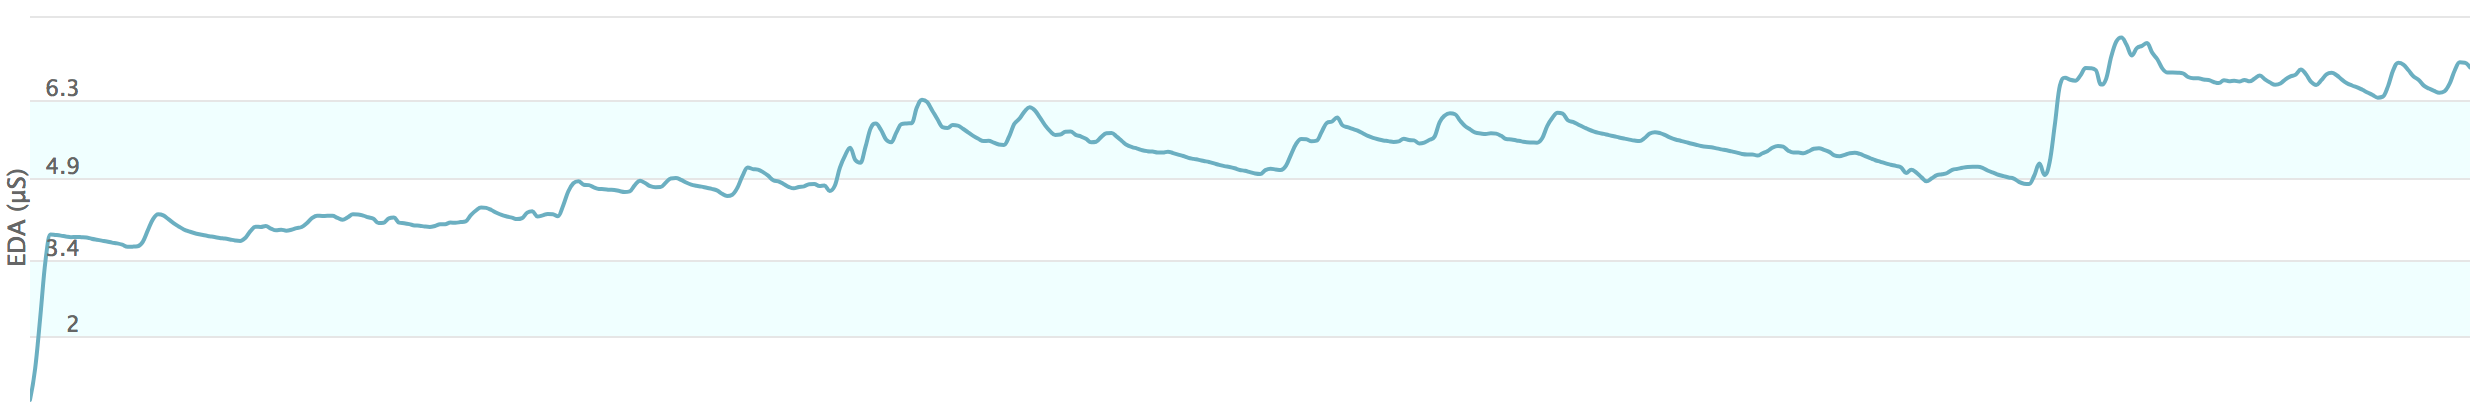
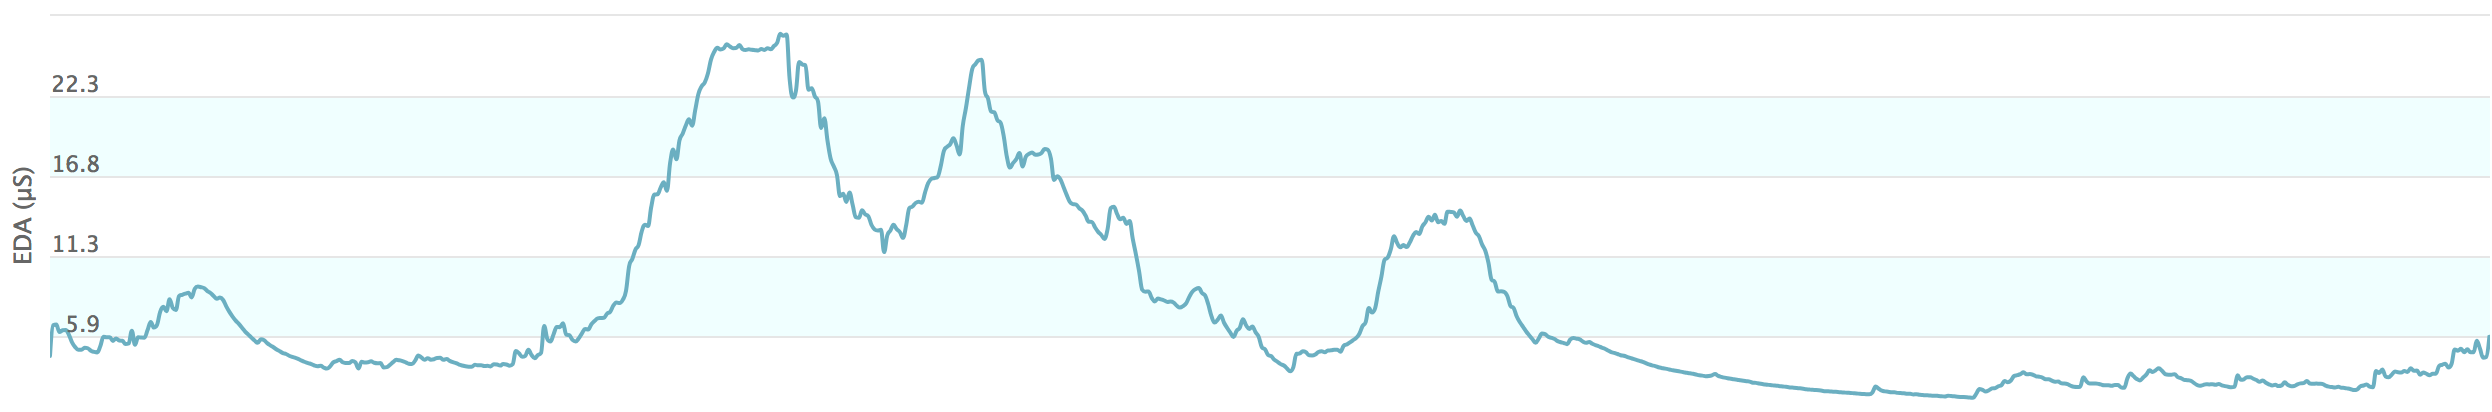
Below are some examples of expected EDA values with their graphic representation on the E4 Connect portal.
a) Example of a low tonic phase, with an insignificant phasic activity (45-minute long segment)
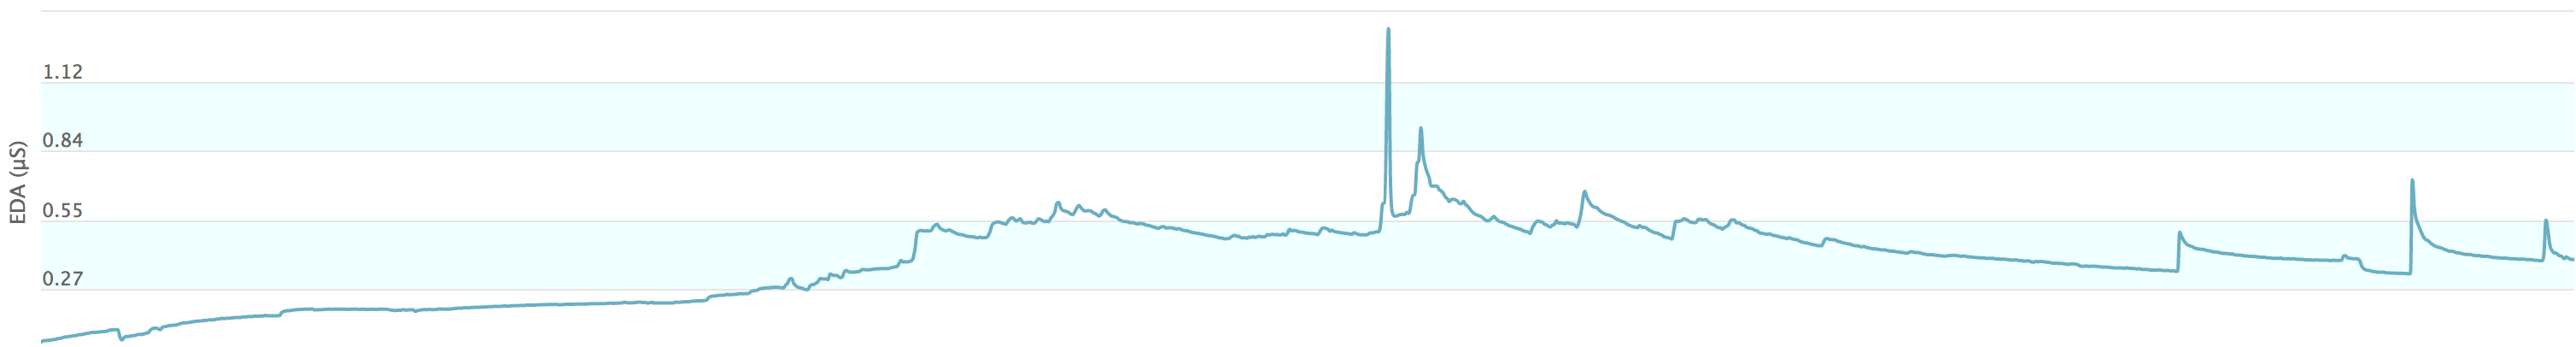
b) Example of low tonic phase with a phasic activity (35-minute long segment)
c) Example of a low tonic phase with a significant phasic activity (2.5-hour long segment)
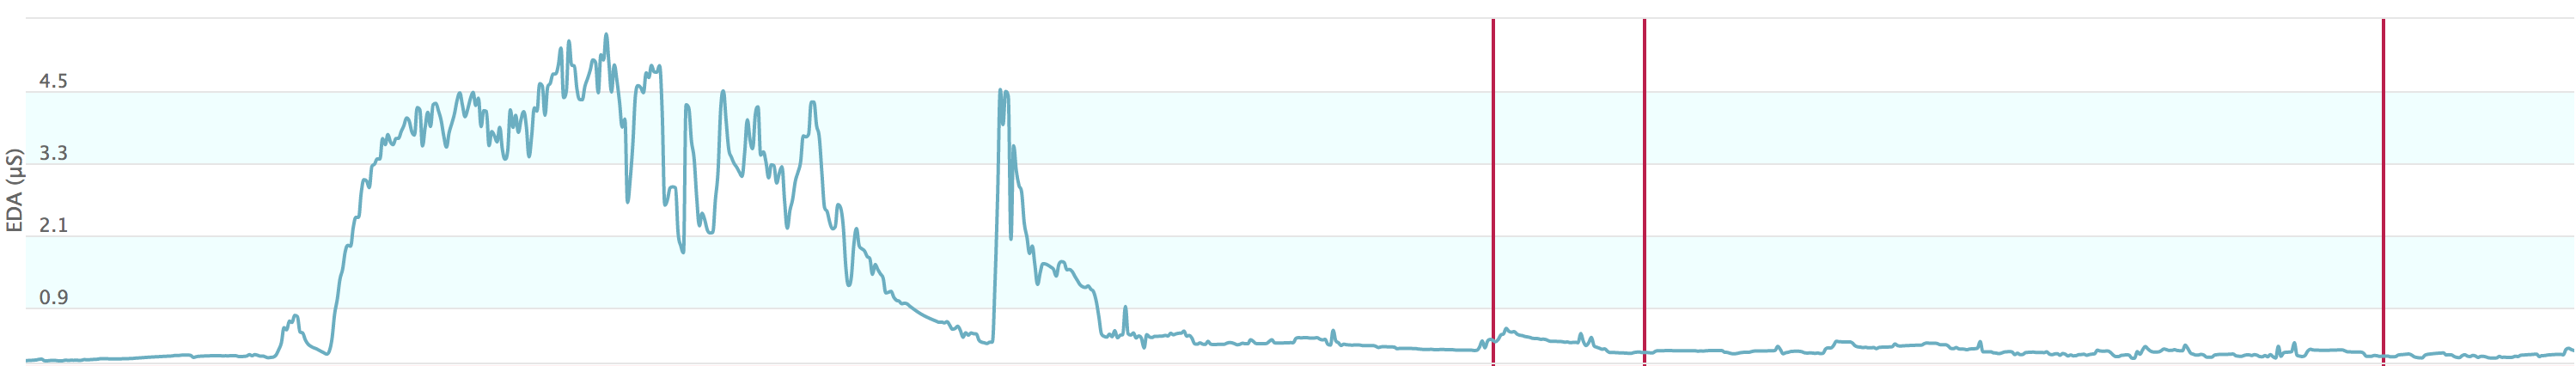
d) Example of a high tonic phase with low phasic activity (4-minute long segment)
e) Example of a high tonic phase with significant phasic activity (1-hour long segment)
Downloading data from your E4 E4 connect allows you to access raw data in CSV format for all of your Empatica E4 data. Data can be downloaded as a compressed directory (ZIP) containing the following files
ACC.csv - Data from 3-axis accelerometer sensor in the range [-2g, 2g]. (sampled at 32 Hz)
BVP.csv - Data from photoplethysmograph (PPG). (sampled at 64 Hz)
EDA.csv - Data from the electrodermal activity sensor in μS. (sampled at 4 Hz)
IBI.csv - Inter beat intervals. (intermittent output with 1/64 second resolution)
TEMP.csv - Data from temperature sensor expressed in degrees on the Celsius (°C) scale (sampled at 4 Hz)
HR.csv - This file contains the average heart rate values, computed in spans of 10 seconds
info.txt - Descriptions of the files
Each sensor's sample rate is hard coded in firmware and optimized to capture the frequency content of relevant signals. The format of each of these files is described below:
IBI.csv 1381290418.000000, IBI <-- t0, initial time of the data (unix timestamp or seconds from 1-1-1970 in UTC) + name 7.734375,0.875000 <-- sequence of IBIs : t, IBI(t) where t are the seconds from t0 8.609375,0.953125 for a sequence of correctly detected IBIs you have t1 , ibi(t1) t2 , ibi(t2) t3 , .. and t2 - t1 = ibi(t1)
*Note that IBI data is reported only when BVP signal is clear. Gaps in the IBI data are identifiable when t2-t1 ≠ ibi(t2).
ACC.csv 1380399004.000000, 1380399004.000000, 1380399004.000000 <--- t0, initial time of the data for all channels 32.000000, 32.000000, 32.000000 <-- sampling rate for all channels 27,-25,50 <-- x, y, z value of acceleration at sample #1** 27,-24,50 <-- x, y, z value of acceleration at sample #2, etc. 27,-24,51 26,-23,51 **For analytic purposes you can interpret the raw data as follows:
xg = x * 2/128
a value of x = 64 is in practice 1g
BVP.csv , EDA.csv, TEMP.csv 1380399004.000000 <--- t0, initial time of the data 64.000000 <-- sampling rate -0.251772 <-- value -1.208777 -2.865649 -1.993523 -0.273807 0.535328
Contact our [support team](mailto: support@empatica.com) if you need any help with data extraction from your E4 device, or reach out to our sales team for more information about pricing and demos.