
Challenge
We used the social identity theory framework to assess differences in emotional reactions of Dutch and German visitors to stories of the Second World War presented at a Dutch museum exhibit. We wanted to measure emotional reactions using physiological signals of heart rate and heart rate variability as well as self-report. We needed to track participants over the course of the 1-2 hour visit as well as clearly marking the beginning and end of the experience. Measurements needed to be precisely timestamped so as to be mapped spatially.
Solution
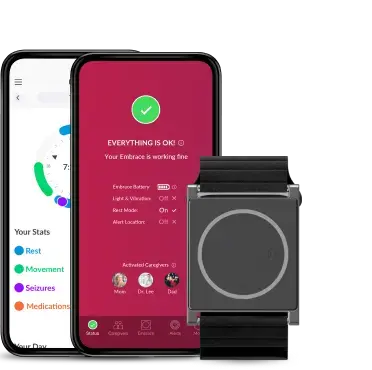
Empatica E4 wristbands were handed out to visitors alongside a tablet-administered intake questionnaire. We synced the data from the E4 with smartphone data from a custom app which recorded Bluetooth beacon signals. We used heart rate data from the E4 to calculate heart rate variability according to standard deviation within a sliding window. The button on the E4 allowed us to mark the beginning and end of the visit for each participant, even when visit duration varied dramatically.